subway-access
NYC subway accessibility — stations, outages, and tract-level need
subway-access · Python
Spatial analysis toolkit for evaluating NYC subway accessibility, reliability, and equity gaps.
What It Is
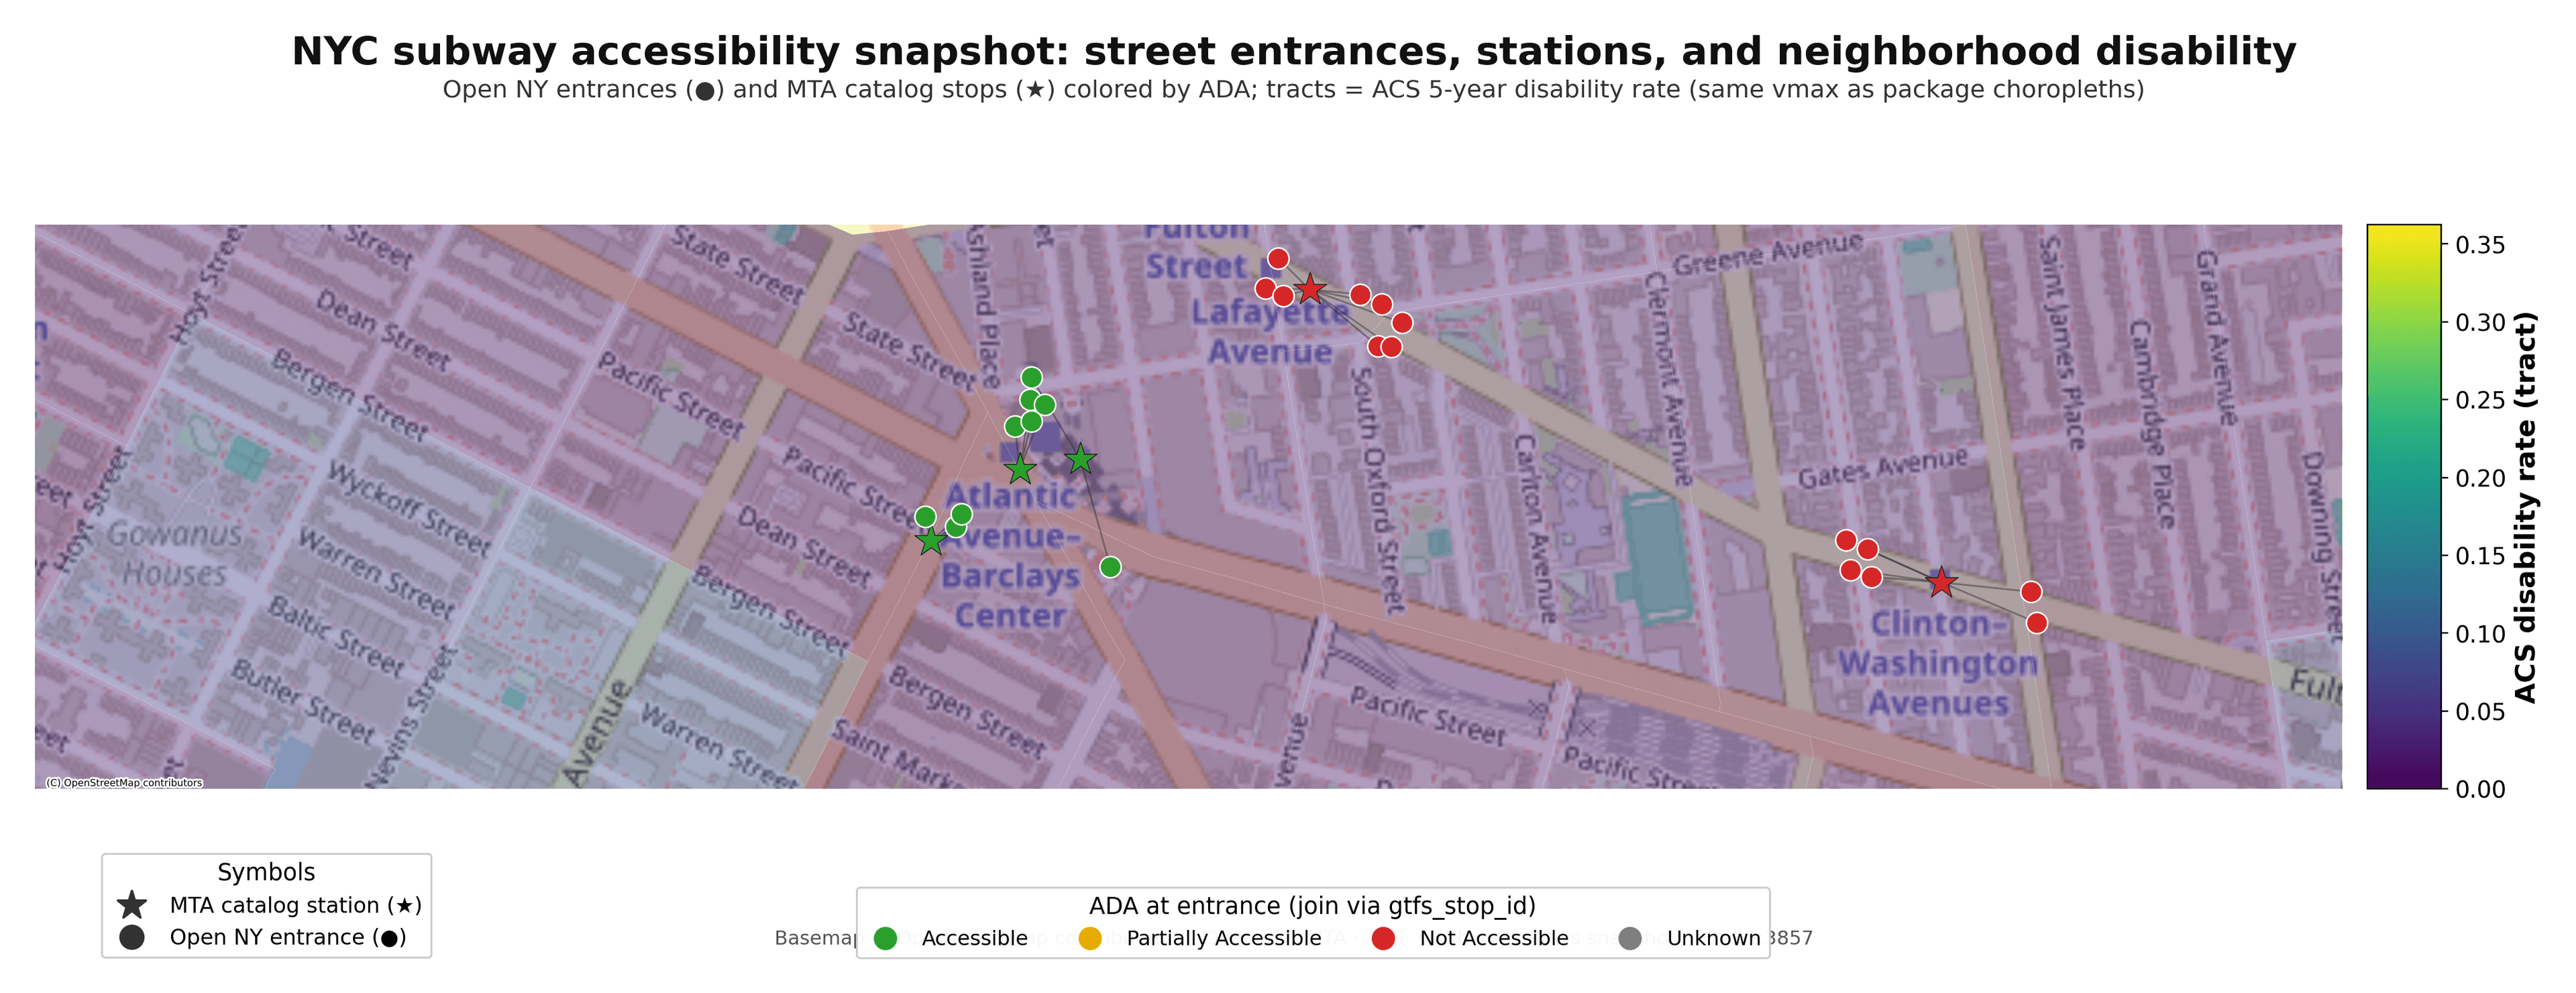
subway-access measures neighborhood-level access to accessible subway service using official MTA and Census sources, cached snapshots, and a transparent analysis pipeline. Euclidean catchments serve as the baseline, with OSM walking-network isochrones available as an advanced comparison layer.
Why It Exists
ADA flags on stations answer one question; policy and equity work needs another: which areas are poorly served in practice when outages, distance, and demographics are in the picture? This package is a reusable toolkit toward that question.
What Ships in 0.5
Core pipeline — fetch MTA stations and ADA status, elevator/escalator availability history, and ACS tract-level demographics for a selected study area. Cache reusable snapshot bundles and run analysis from the CLI (subway-access fetch-snapshot, subway-access analyze-snapshot).
Engine-audit appendix (new in 0.5) — primary CASESTUDY numbers are protected; a lazy bridge into factor-factory cross-checks the same panel against TWFE / Callaway-Sant'Anna / RD-robust / Moran's I and publishes the results as Appendix D.
Factor pipeline — class-based Factor / Pipeline system with seven built-in factors: NeedScore, Coverage, GapScore, NearestStationDistance, NearestStationTravelMinutes, StationCount, and ReliabilityWeightedCoverage. Custom factors via subclassing with an extensible extras slot for external data.
Temporal panel infrastructure — multi-vintage ACS fetcher for longitudinal demographics, station ADA upgrade timeline construction via build_upgrade_timeline(), geographic panel dataset builder (tract x year), treatment/control group splitting, and distance-based spatial weights with a PySAL bridge.
SDK surface — 10 public modules with 123 public symbols: models, io, analysis, factors, helpers, export, pipeline, temporal, cli, and more.
Study areas are selected through nyc-geo-toolkit. Seven self-contained examples ship under examples/, including accessibility-change-over-time (full research pipeline with factor analysis, temporal panel, and auto-generated reports) and network-access-comparison (Euclidean vs OSM walking network).
Ecosystem Fit
Sits beside nyc311 as another NYC open-data workflow: shared geography from nyc-geo-toolkit, domain logic and exports specific to transit accessibility and reliability here.
═══════════════════════════════════════
Best viewed in Netscape Navigator 4.0at 800×600
© 2026 Blaise Albis-Burdige | albisburdige@protonmail.com
[ Top of Page ]